Trace Plots from Master Plan
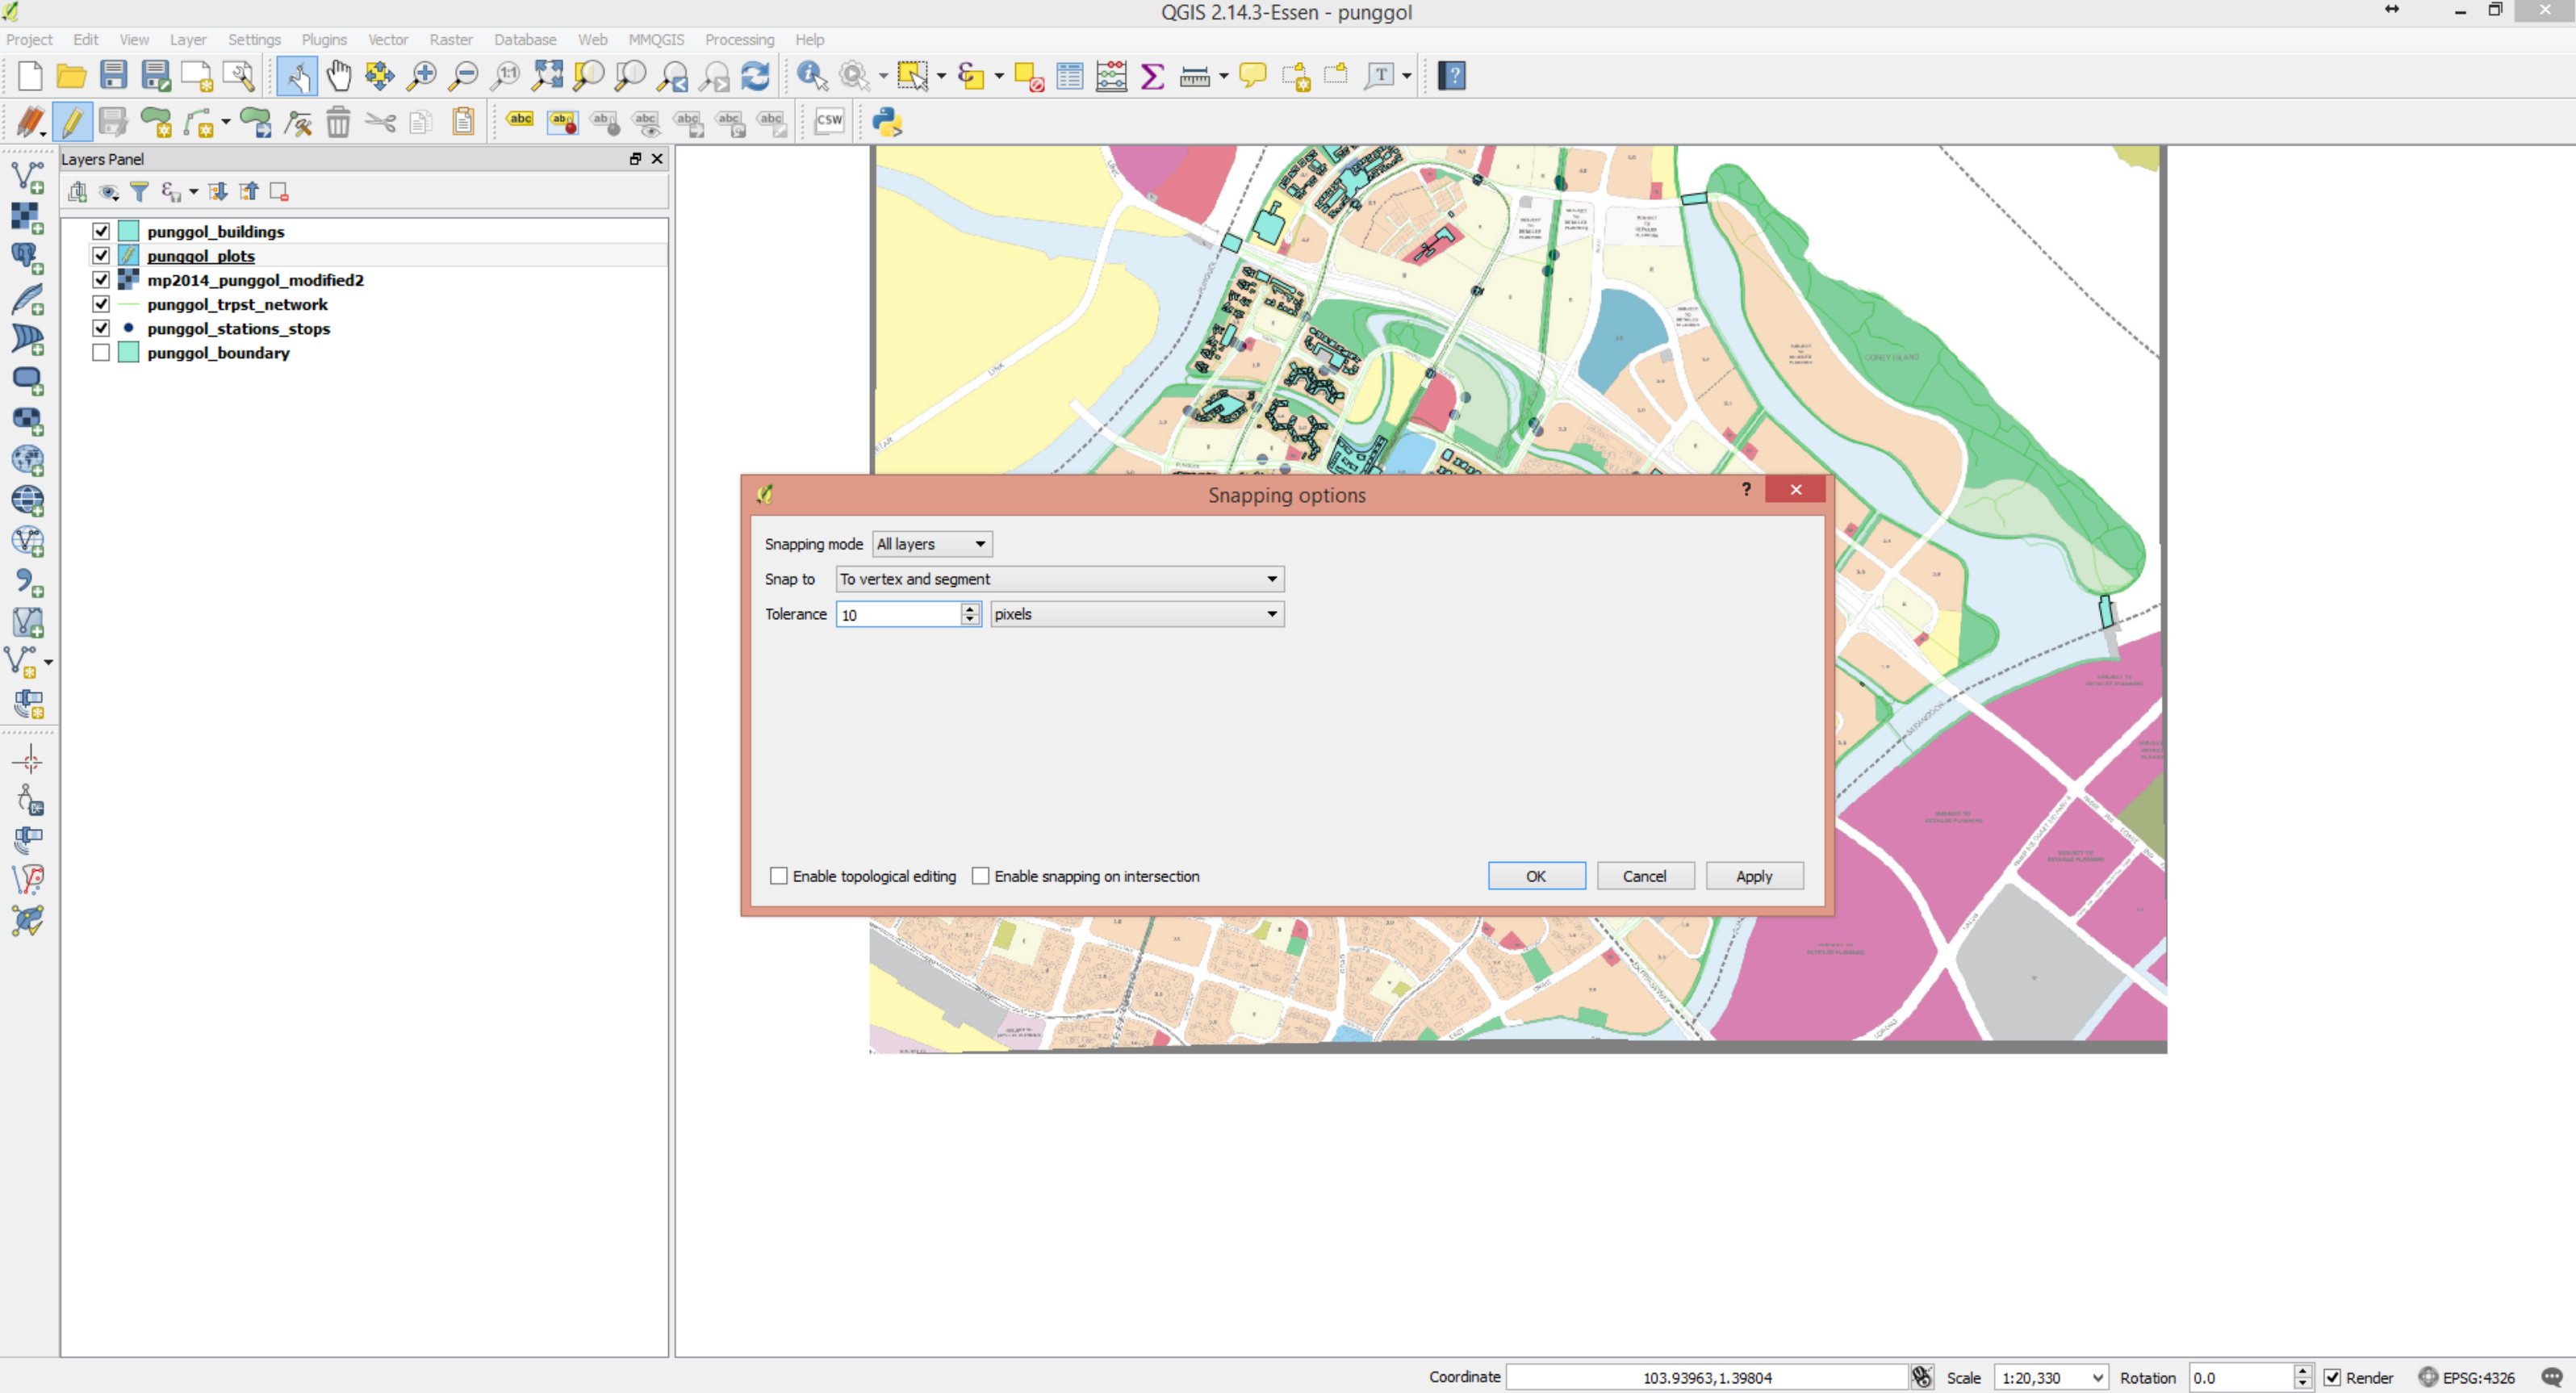
- 1.) Go to Settings -> Snapping Options... In the dialog box, make the following changes:
- Snapping mode: all layers
- Snap to: To Vertex and segment
- Tolerance: 10, pixels
- 2.) In the Attribute table dialog box, click on "Add field". In the dialog box, make the following changes:
- Name: plot_ratio
- Type: Decimal number (real)
- Length:2
- Precision:1

- 3.) Right click on the "punggol_buildings" layer -> Save as... Save the layer as "punggol_plots" (Refer to Chapter: Extract OSM map to QGIS Step 9 on how to export a layer).
- i.) click on the "punggol_plots" layer.
- ii.) click on the "Open Attribute Table" icon.
- iii.) click on the "Toggle Editing Mode" icon.
- iv.) Use the keyboard shortcut key "Crtl + a" to select all rows in the attribute table. Click on "Delete selected feature".

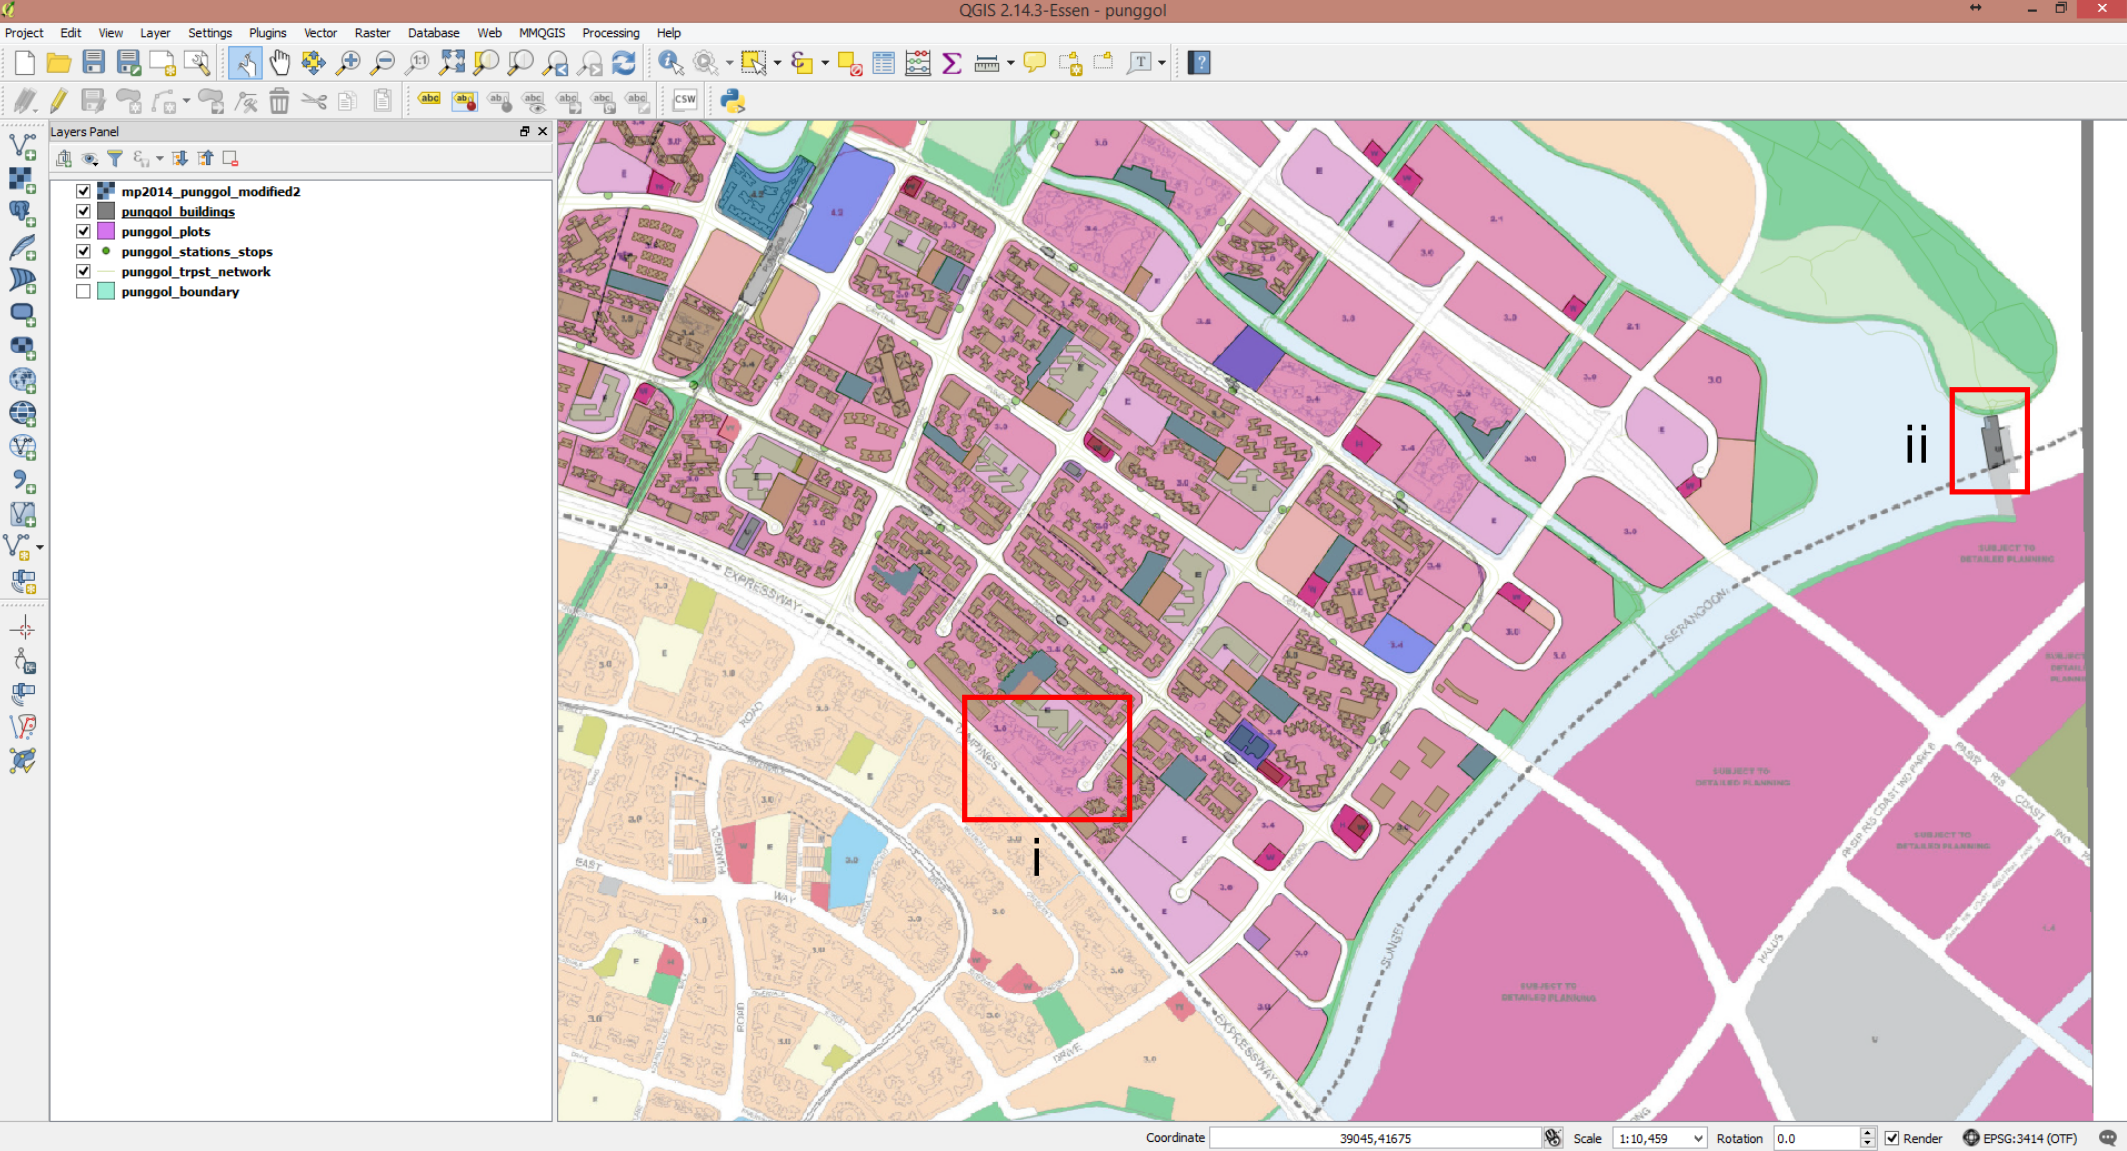
- 4.) Trace the plots. Make sure the punggol_plots layer is below the punggol_buildings.
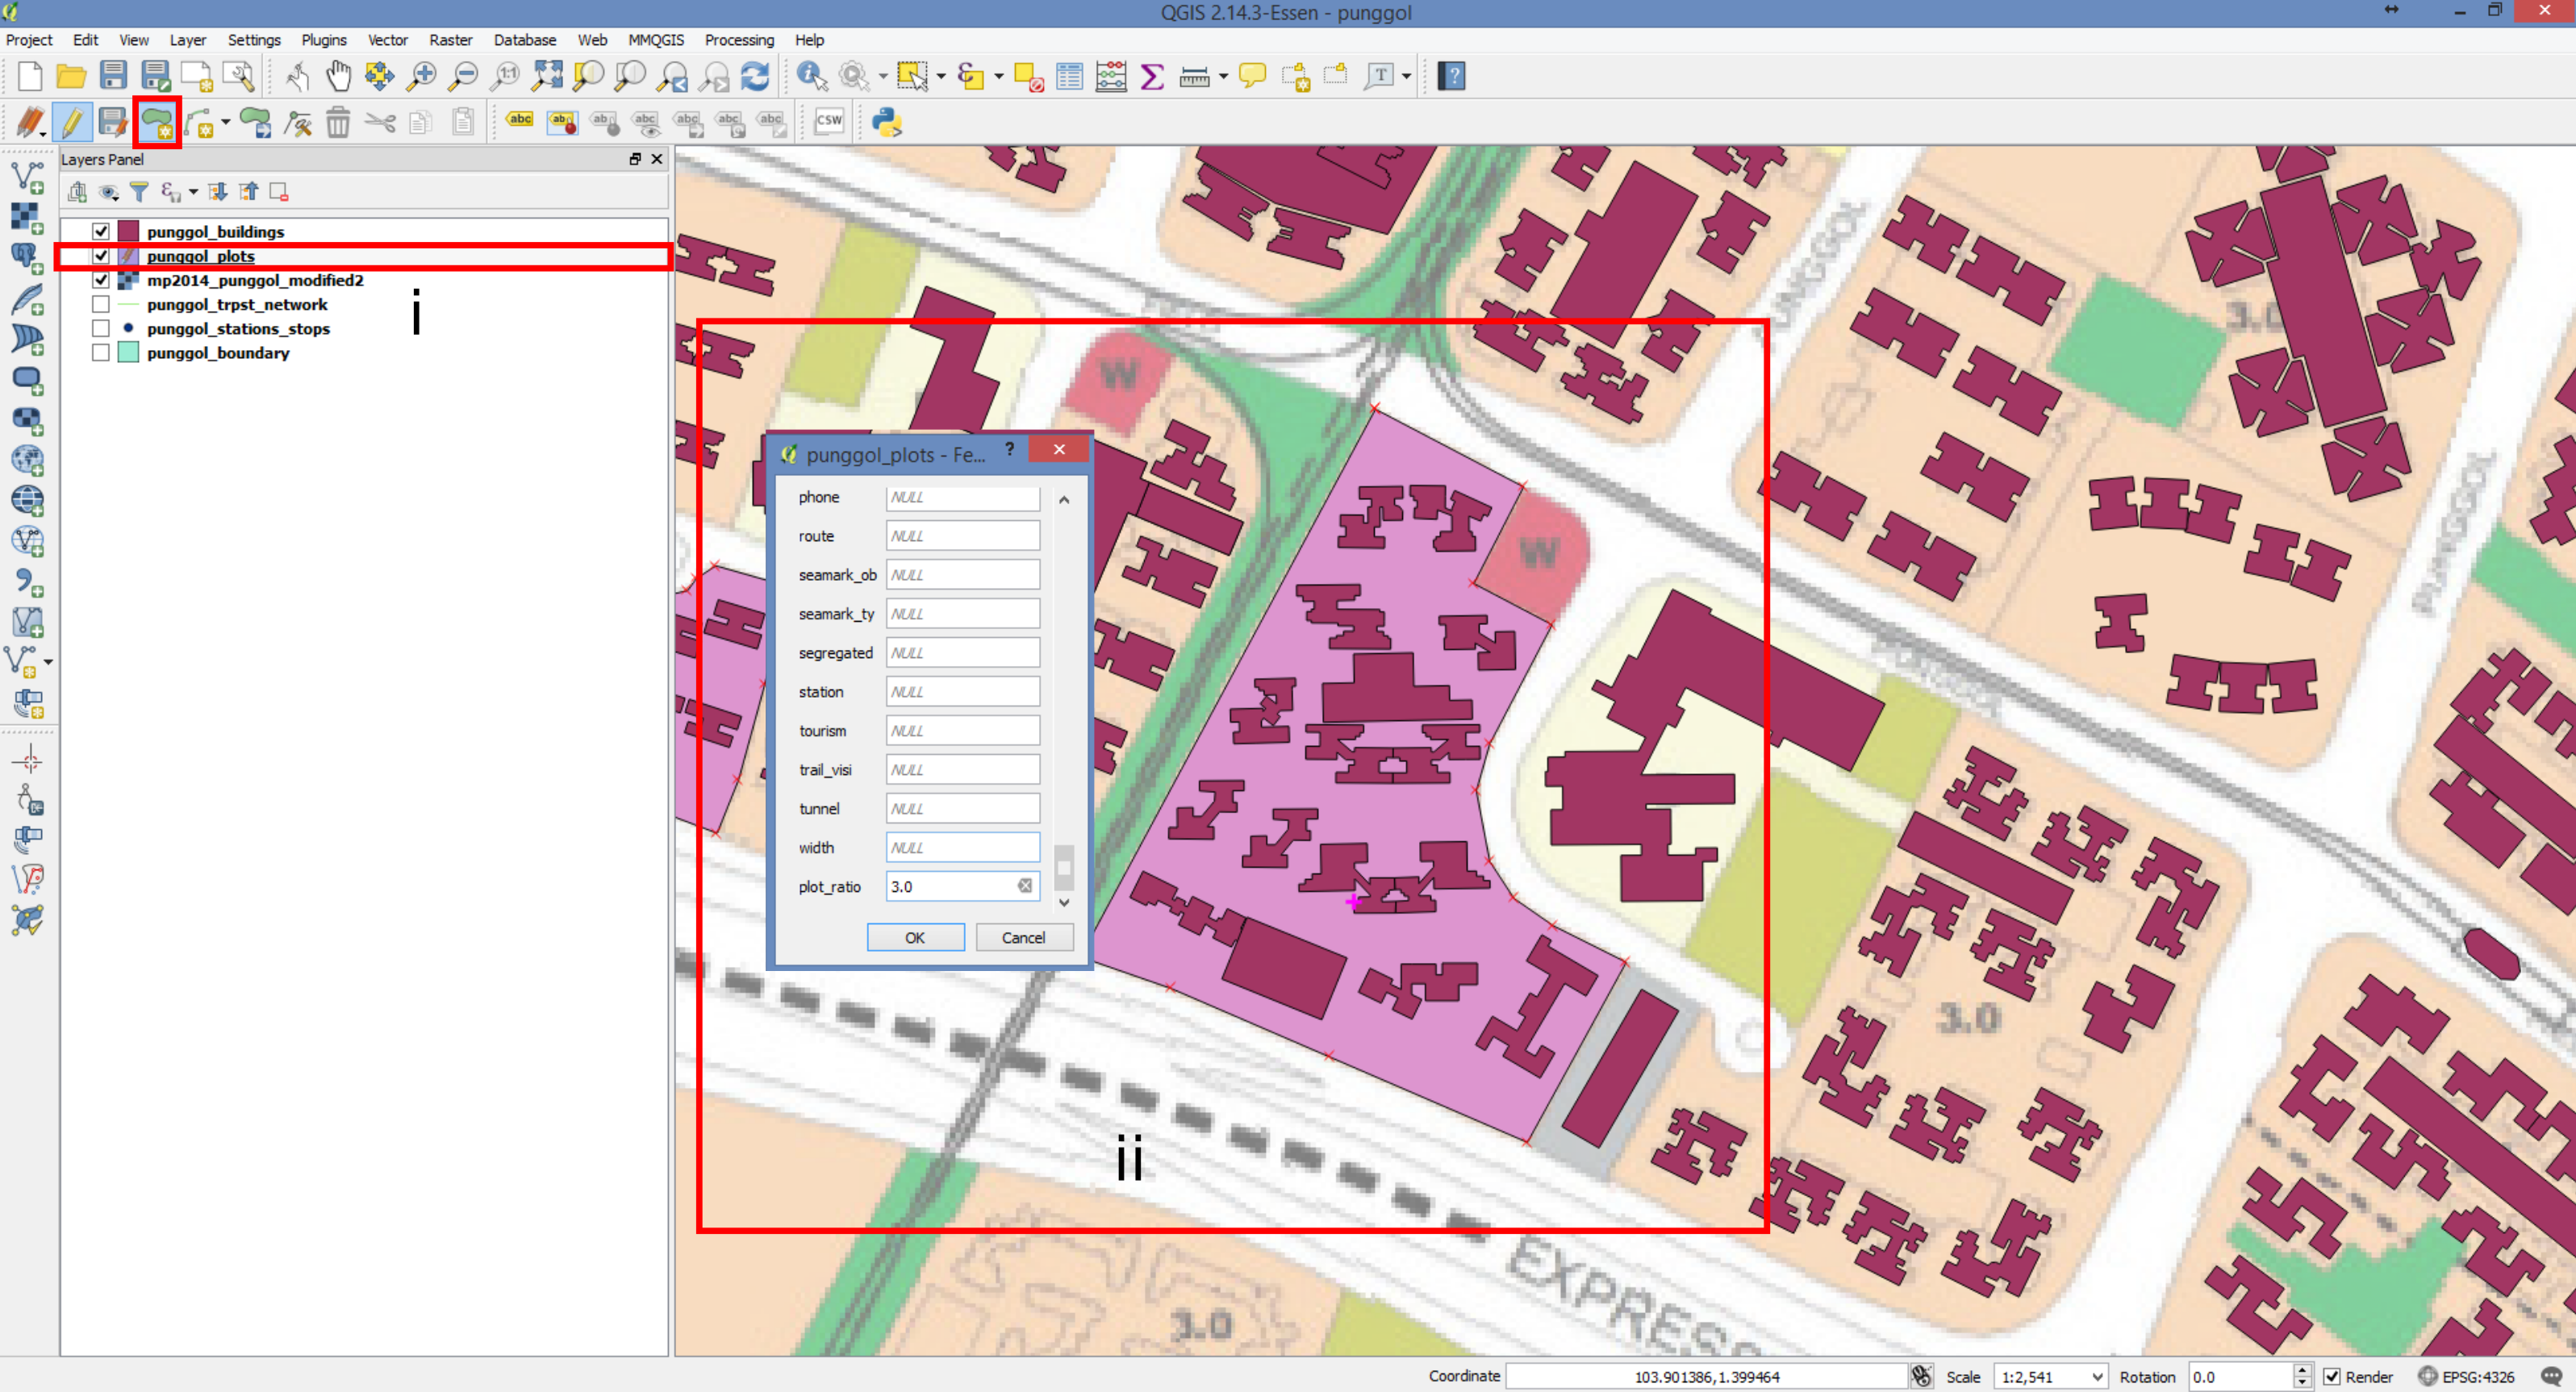
- i.) Select the punggol_plots layer. Click on the "Add Feature" icon.
- ii.) Trace the plot, right click when done tracing. Fill in the plot_ratio and landuse attributes according to the master plan. The legends of the master plan can be downloaded from the URA website.
- iii.) Input one of this pre-specified landuse categories to describe the landuse:
- residential
- transport
- recreation_ground (all parks and open space are labelled as recreation_ground)
- education
- commercial
- civic
- mixed
- place_of_worship
- reserve
- utility
- health
- 4.) Adjust the punggol_buildings layer according to all the overlays of shapefiles.
- i.) Trace missing buildings from the OSM layers according to the master plan.
- ii.) Remove redundant buildings.
- iii.) verify the information with other sources, such as google earth.